Step by Step Guide to Add Google Analytics in Shopify Store


Want to understand your Shopify store’s performance and customer behavior better? Adding Google Analytics can provide the detailed data you need.
This tool offers insights into who your visitors are, what they’re doing on your site, and how you can improve their experience.
Follow this step-by-step guide on how to add Google Analytics in Shopify to gain valuable insights and boost your store’s success.
What Analytics Does Shopify Offer?
Shopify provides its own analytics tool, known as Shopify Analytics. Depending on your plan, the features available can vary.
If you’re on the basic plan or higher, you’ll get:
- Sales reports: Analyze your sales across different channels and track product performance over time.
- Finance summaries: Monitor fees, taxes, bills, and payments for a clear financial overview.
- Real-time activity: See live site activity, including sales and visitor locations.
- Traffic insights: Discover where your traffic comes from, whether direct or referred and get insights into social media and geographical sources.
For more advanced functionality, some plans offer additional features. Check your plan to see what’s available.
Why Use Google Analytics?
Shopify’s analytics are handy, but they don’t offer the same depth as Google Analytics 4 (GA4). With GA4, you get a dashboard that tracks things like page views, bounce rates, and how long visitors stay on your site.
Plus, while Shopify focuses on your store, GA4 tracks ad campaigns and shows where your traffic is coming from. You’ll get a clearer picture of what’s driving visitors to your site and how they interact with it.
In short, Google Analytics gives you a richer view of customer behavior and site performance.
Google Analytics vs. Shopify Analytics
Google Analytics 4 (GA4) offers more features than Shopify Analytics. Shopify’s reports are useful for tracking sales, but GA4 digs deeper with:
Detailed Visitor Tracking
GA4 tracks where visitors come from, who they are, and what they do on your site. This helps you understand your audience better and adjust your approach to meet their needs.
Customizable Insights
GA4 lets you create reports that focus on the data you need. Tailor it to track specific metrics about how visitors use your site. Get the detailed info necessary to make smart decisions and
Google Tools’ Integration
GA4 connects easily with Google Ads and Google Search Console. These integrations give you a complete view of your site’s performance, combining analytics with advertising and search data.
How to Add Google Analytics to Shopify
Setting up Google Analytics for Shopify requires a few key steps:
Step 1: Create a Google Analytics Account
First, visit Google Analytics. If you have a Gmail account, log in with it. If not, sign up for a new Gmail account. After logging in, you’ll see a welcome screen—click the Sign-Up button.
Next, choose Web as your tracking method. Enter a name for your analytics account, your website's name, and URL, and select your industry category from the dropdown. Leave the default checkboxes as they are, then scroll down and click Get Tracking ID.
Agree to the terms and conditions to proceed to your Google Analytics account.
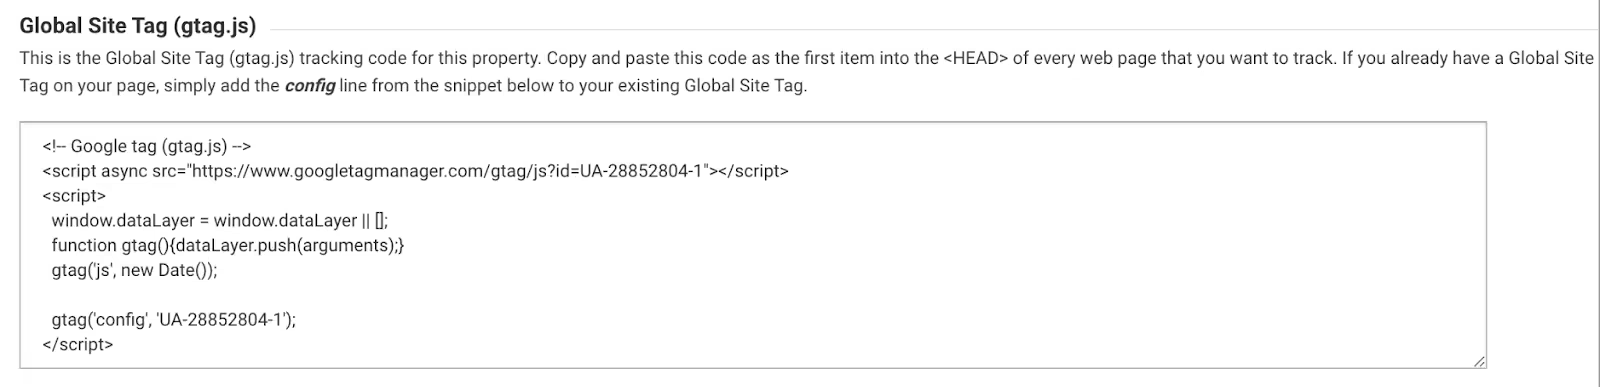
Step 2: Find Your Tracking Code
On your first visit, you’ll see the tracking info section with your tracking ID and the script you need to insert into your Shopify store.
If you navigate away and need to find it again, go to Admin > Property > Tracking Info > Tracking Code.
Step 3: Add the Tracking Code to Shopify
Wondering how to add Google Analytics code in Shopify? Log into Shopify and go to your admin panel. Click Online Store, then Preferences.
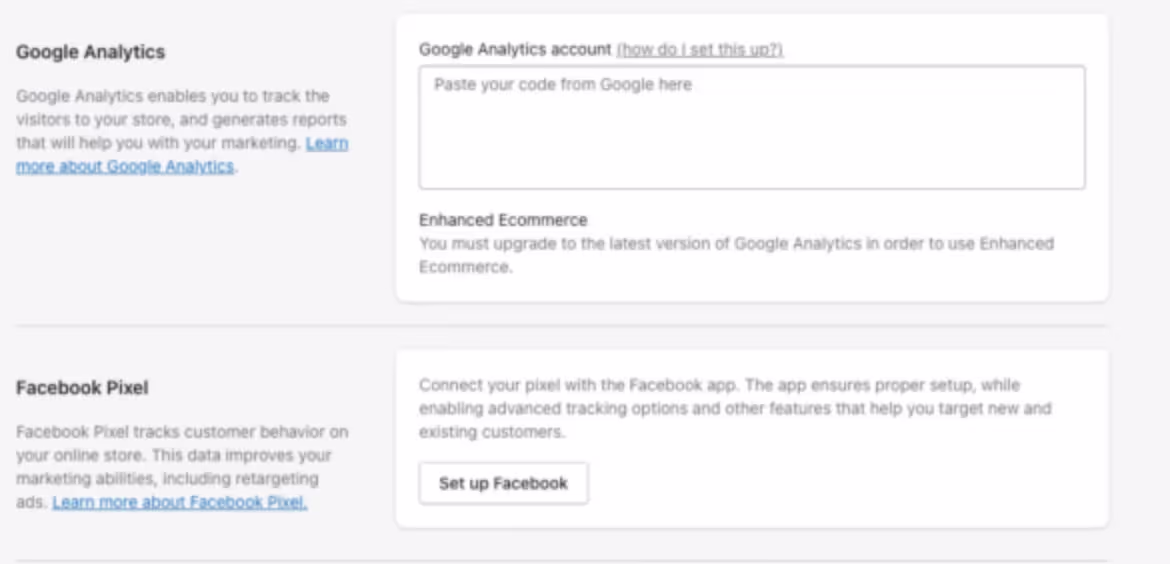
Paste the analytics tracking code into the Google Analytics account field. Click Save to apply.
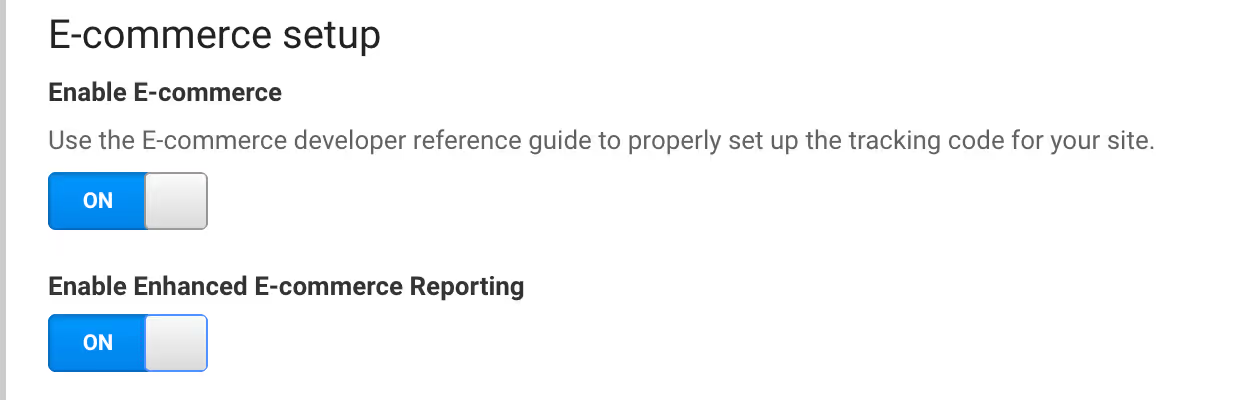
For more detailed tracking, enable enhanced eCommerce by checking the Use Enhanced Ecommerce box in the Google Analytics section and saving again.
Step 4: Verify Existing Analytics Setup
Check if Google Analytics is already active. In Shopify, go to Online Store > Preferences and look at the Google Analytics section. If there’s a code starting with 'UA-', Universal Analytics is already enabled. To update it, go to Themes > Actions > Edit code, and find the theme.liquid file, and remove any existing analytics tags.
Step 5: Explore Google Analytics Features
In Google Analytics, set up different views—raw, custom, or test views. These give you various perspectives on your store’s performance. Start with the basics and explore enhanced analytics later for more detailed visitor insights.
Step 6: Match Shopify and Google Analytics Settings
Ensure your currency and time zone settings in Google Analytics match those in Shopify. Go to Google Analytics View settings and select the same currency and time zone used in your Shopify settings. This helps in accurate data comparison.
Step 7: Set Up Content Groups
Organize your Shopify pages into content groups in Google Analytics. Navigate to Admin > Content Grouping, create a new group, and configure it to segment your traffic by page type, product category, or other criteria important to your business.

Step 8: Activate Google Signals
Turn on Google Signals for advanced tracking. In Google Analytics, go to Admin > Tracking Info > Data Collection, and follow the prompts to activate Google Signals. This provides additional data about user behavior and demographics.
Step 9: Set Up Goals and Funnels
Create goals and funnels in Google Analytics to map out customer journeys. Go to Admin > Goals, create a new goal, and set up a funnel to visualize customer paths and identify areas for improvement.
Step 10: Configure Google Tag Manager
To track more than just the basics on your Shopify site, use Google Tag Manager (GTM). It lets you add tags to your pages without messing with the code. GTM simplifies adding detailed tracking for actions like button clicks or form submissions.
If you're using Universal Analytics and planning to switch to GA4, you can migrate your tags starting March 2023. Setting up GTM now will make the transition smoother. For detailed guidance on using GTM with Google Analytics, check out online resources.

Step 11: Test and Refund
Test your Google Analytics setup by making a sample purchase on your Shopify store. Go through the checkout process, complete the payment, and then check Google Analytics to confirm the data is tracked. Afterward, refund the sample order through Shopify to avoid unnecessary charges.
Step 12: Monitor and Adjust
Return to Google Analytics after 24 hours to review the data collected. Use the insights to monitor user behavior, optimize your store, and make informed business decisions. Regularly check reports in the Real-Time and Reports sections to stay updated.
Building Reports in Google Analytics
Google Analytics offers a variety of reports to help you understand your website's performance. Here’s how to build reports that will make your data more useful:
Understanding Your Audience
Want to see who’s visiting your site? Build reports to track demographics. In Universal Analytics, check out the pre-set Demographics section for insights like age and gender. GA4 lets you customize these reports even more. You can see how different age groups and genders interact with your site. Also, set up reports based on your visitors’ interests. It helps you understand what attracts them.
How Visitors Navigate Your Site
Curious about how people move through your site? In Universal Analytics, the Users Flow report shows the paths they take. It’s like a roadmap of how they interact with different pages. GA4 offers the User Explorer report for a more detailed look. This can help you spot where visitors might get stuck or what keeps them engaged.
Tracking Locations
Ever wonder where your visitors are coming from? Use location reports to find out. They show you the languages and regions of your visitors. If you just launched a campaign in a new area, this report will show you how it’s doing. In GA4, check out the Real-Time report to see where your current visitors are located.
Finding Out Traffic Sources
Where is your traffic coming from? That’s what acquisition reports are for. They tell you how people are finding your site. Break down your traffic by source, like search engines, social media, or direct visits. GA4 lets you dig deeper by showing traffic by device type and campaign. Universal Analytics offers similar reports under the Acquisition section, so you can see which channels are working best for you.
Checking Your Google Analytics Setup
After linking Google Analytics to your Shopify store, it’s important to ensure the setup works correctly. Start by visiting your store's domain in a web browser. Browse through your pages and interact with your store like a customer would. This action should generate data for Google Analytics.
Next, go to your Google Analytics account and click on the “Real-Time” option in the menu. In this section, you'll be able to see what’s currently happening on your site, including the last 30 minutes. If you see live data, your connection is working fine.
Remember, you can create various views in Google Analytics, such as raw data views or custom-filtered views. These options let you see your data from different perspectives.
You can also explore “enhanced analytics” for more detailed insights into visitor behavior. However, it’s best to get comfortable with the basic features of Google Analytics first before diving into advanced settings.
Key eCommerce Metrics to Track in Google Analytics
Understanding what to track in Google Analytics can feel overwhelming at first. But don’t worry, with a little time, you’ll get the hang of it. Here are the main ecommerce metrics to keep an eye on to see how your online store is doing.
Sessions
Think of sessions as visits to your site. Each session counts how many times someone checks out your store and how long they stick around. Use this to track traffic and see if there are any patterns.
New Users
This shows you the number of first-time visitors. It's great to see how well you’re attracting new folks. If this number is low, your marketing might need a tweak.
Percentage of New Sessions
Want to know how many fresh faces are visiting your site? This metric tells you the percentage of visits from new users. It helps you gauge your success in bringing in newcomers.
Bounce Rate
The bounce rate tells you how many people come to your site and leave right away. If it’s high, they’re not finding what they need or your site isn’t keeping them interested.
Pages per Session
This metric shows how many pages someone visits during their time on your site. A high number means visitors are engaging with your content and exploring more.
Average Session Duration
This is how long people stay on your site per visit. It gives you an idea of how engaging your site is. Longer sessions usually mean they’re finding your content useful.
Transactions
Transactions count the total number of purchases. This gives you a snapshot of your overall sales. Use it to see how many orders are coming in.
eCommerce Conversion Rate
This is the percentage of visits that result in a sale. For example, if 100 people visit your site and 10 make a purchase, your conversion rate is 10%. Track this to see how well your site turns visits into sales.
Revenue
Revenue is the big one—it’s all about how much money you’re making. Google Analytics gives you details on total revenue, revenue per product, and more. It’s essential to see how well your store is performing financially.
Choosing the right metrics to track helps you understand your store’s performance. Use Shopify Analytics for in-depth insights on sales and product performance, as it’s designed to fit seamlessly into your store’s operations. For broader analysis, Google Analytics offers detailed views on visitor behavior and traffic sources.
Enhanced eCommerce Metrics in Google Analytics
You can get lost in the sea of data available, but what really matters? Let’s break down the essential metrics in Google Analytics that give you a deeper look at your online store’s performance.
Product Revenue
Checking overall sales numbers is good, but diving into product-specific revenue is better. It helps you see which items are popular and which aren't. Knowing this can guide your pricing and inventory decisions. For instance, if sneakers are pulling in more money than expected, you might want to stock more or adjust your marketing.
Unique Purchases
This shows how many times individual products are bought. Imagine selling 40 red t-shirts across 30 transactions. This metric helps you spot trends, like if certain products are often bought together, so you can tailor your marketing and offers accordingly.
Quantity Sold
It’s the total count of items sold. Let’s say you move 10 phones, 15 tablets, and 25 chargers in a week. Tracking this helps you know which products are flying off the shelves, revealing demand patterns you might not have noticed otherwise.
Average Price per Item
This metric tells you the average revenue each item brings in. You find this by dividing total revenue by the number of items sold. If you made $1,500 from selling 100 items, your average price is $15. It’s a handy way to check if your pricing strategy needs tweaking.
Average Quantity per Transaction
Wondering how many products people usually buy at once? Calculate it by dividing the number of items sold by the number of transactions. If 45 items were sold in 30 transactions, your average is 1.5. This can help in planning inventory and promotions.
Cart-to-Detail Rate
This metric shows the percentage of people who add a product to their cart after viewing its page. High rates here mean your product pages are doing their job—convincing folks to take the next step. If your cart-to-detail rate is low, you might need to rethink your product descriptions or images.
Buy-to-Detail Rate
This metric is about how many people actually buy the product after putting it in their cart. If 60% of shoppers add a product but only 30% buy, you might need to look into your checkout process or offer better incentives to complete the purchase.
Final Verdict
There you go—we’ve shared all the steps. Now go ahead and integrate Google Analytics with your Shopify store. With Google Analytics, you'll gain a clearer view of your audience and can make decisions that help grow your online business.
FAQs
Can You Use Google Analytics with Shopify?
Yes, you can. Follow the guide above to integrate Google Analytics with Shopify. Head to your Shopify admin, go to Online Store, then Preferences. You'll see a section for Google Analytics where you paste your tracking code. Be sure to enable eCommerce settings in Google Analytics for full functionality.
Is Google Analytics Necessary if I Have Shopify Analytics?
You don't need to use Google Analytics if you already have Shopify Analytics, but using both gives you a fuller view of your store's performance. Shopify Analytics provides basic traffic data like visits and page views. However, it doesn’t show detailed visitor behavior. Google Analytics adds deeper insights into which pages are most popular, how long visitors stay, and conversion rates, helping you refine your marketing and site layout.
Does Shopify Automatically Integrate with Google Analytics?
No, you need to add Google Analytics manually. Get the tracking code from Google Analytics, then paste it into the Google Analytics section under Online Store > Preferences in your Shopify admin. Enable enhanced eCommerce tracking for detailed insights.